
The science behind the maps
ScienceLab is the research-focused space dedicated to scientists and experts interested the CitySatAir iniciative. It provides open-source access to the Retina system, associated datasets and models, and scientific publications, supporting transparent, reproducible, and collaborative advances in satellite-based, high-resolution urban air-quality assessment.
Retina: Urban scale air quality research
About the research
Understanding urban air pollution requires detailed local observations, but dense networks of reference monitoring stations are expensive and unavailable in many cities, particularly in low- and middle-income countries. Low-cost sensors and new satellite observations offer valuable alternatives, each with complementary strengths. CitySatAir brings these data sources together using innovative methods to produce high-resolution maps of urban air quality, making detailed air pollution information more widely accessible.
The Retina algorithm provides a physics-based and flexible approach for high-resolution modelling of urban air pollution. At its core is the open-source AERMOD dispersion model, which is used to generate hourly street-level maps. Retina combines weather data, local emission estimates, and air quality measurements from different types of monitoring networks (either reference or low-cost or from satellite observations) to improve the accuracy of the pollution maps.
To run Retina for your own city, you can access the full source code and input data examples from the Retina v2 (Madrid) study. The repository includes the scripts and datasets needed to reproduce the published results, including urban NO₂ concentration maps for March 2019.
The code and accompanying data are archived at DOI: https://doi.org/10.5281/zenodo.15096617.
Retina is open source, and we welcome contributions from the developer community to help improve and extend the model.
Madrid
The Retina algorithm was validated for the city of Madrid using observations from March 2019 (Mijling et al., 2025). Although seasonal variability in NO₂ concentrations exists, March 2019 is considered representative of annual-average conditions.
When emissions are optimised using only TROPOMI observations, representing the situation of a city without any in-situ monitoring network, the resulting hourly NO₂ concentration fields achieve a city-wide root mean square error (RMSE) of 19.3 µg/m³ with an average bias of 0.8 µg/m³. This demonstrates that satellite observations alone can provide meaningful constraints on urban emission patterns and produce realistic concentration maps.
Higher accuracy is obtained when hourly in-situ measurements are available. Ground-based observations improve the estimation of the diurnal emission cycle and can be assimilated spatially into the simulated concentration fields. Using all 24 reference stations in Madrid, the average correlation coefficient of the hourly NO₂ time series increases to 0.90, while the RMSE decreases to 13.0 µg/m³, corresponding to a relative error of 36%.
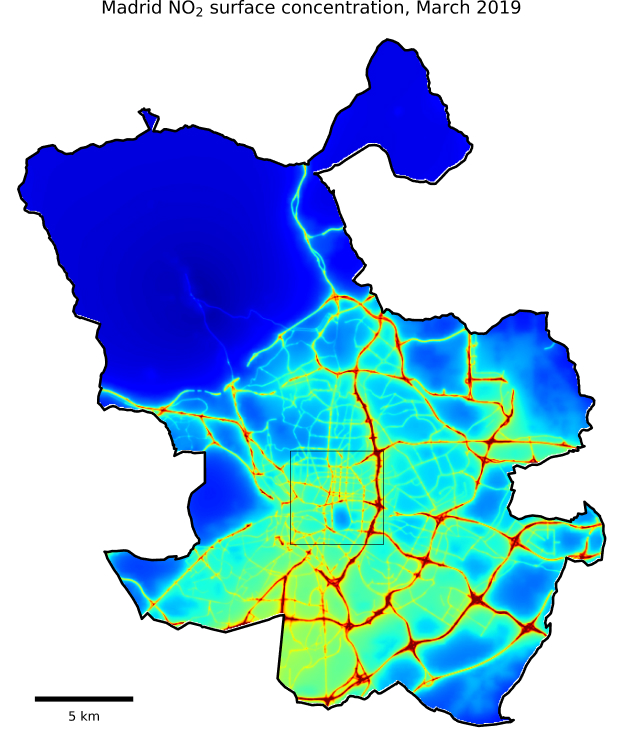
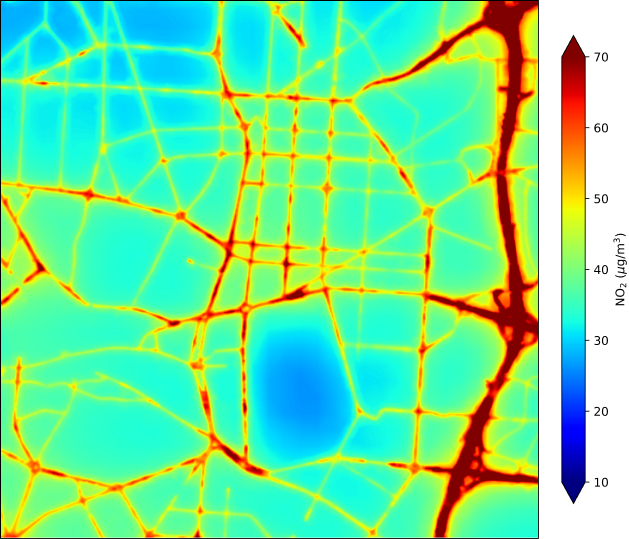
The figure above presents the average NO₂ concentration map for March 2019 produced by the Retina algorithm using hourly observations from the 24 reference stations. Highest concentrations are found on and near the highways, such as the M30 surrounding the city centre in the East and South. Lowest concentrations are found in the sparsely populated El Pardo area in the north. Local concentration reductions are found in e.g. El Retiro park. Note the accumulation of air pollution in the southwest area of the municipality due to predominant winds (1-3 Beaufort) from the northeast in this period. The right panel zooms in on an 5x5 km2 area around Retiro city park, where concentrations are notably lower than in nearby roads and built-up areas.
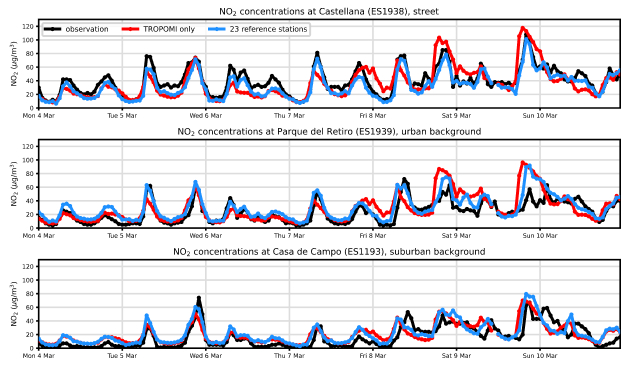
The figure above illustrates the performance of the Retina algorithm at three representative monitoring locations: a roadside station, an urban background station, and a suburban background station, for a representative week in March 2019. The red line represents simulations from the Retina algorithm using only TROPOMI observations for emission optimisation; the blue line represents the leave-one-out time series using data from all other reference stations. This experiment demonstrates the added value of the ground-based monitoring network in reproducing local temporal variability in NO₂ concentrations.
Rome
Coming soon.
Bratislava
Coming soon.
The following is a list of scientific articles that are either directly coming out of the CitySatAir research or in part linked to the work.
Mijling, B., 2020. High-resolution mapping of urban air quality with heterogeneous observations: a new methodology and its application to Amsterdam.Atmospheric Measurement Techniques, 13(8), pp.4601-4617.
Mijling, B., Eskes, H., Hofmann, S., Moreno, P., García Falin, D. and de Vega Pastor, M.E., 2025. High-resolution mapping of urban NO2 concentrations using Retina v2: a case study on data assimilation of surface and satellite observations in Madrid.Geoscientific Model Development,18(18), pp.6439-6460.
Urban transport research
About the research
Reliable estimates of street-level air pollution depend on accurate information about local traffic. Within CitySatAir, we are developing a flexible traffic module that provides up-to-date estimates of traffic volumes for individual roads in urban areas. Building on a machine learning model originally developed for Norway, the module is being expanded into a tool that can be used in cities across Europe and beyond.
Coming soon.
Coming soon.
Regional scale air quality research
About the research
For regional air quality mapping, CitySatAir is further developing S-MESH, a machine-learning framework that produces daily air quality maps across Europe at 1 km resolution for nitrogen dioxide (NO2) and particulate matter (PM2.5). S-MESH combines satellite observations, atmospheric model data, meteorology, land-use information, and ground-based measurements.
For NO₂, S-MESH was evaluated against independent monitoring stations that were not used for training. The model achieved a mean absolute error of 7.77 µg/m³, a median bias of 0.6 µg/m³, and a Spearman rank correlation of 0.66 for 2019–2020. A separate evaluation for 2021 showed similar performance, indicating that the model was not simply fitted to the training years. The model performed best at moderate NO₂ concentration levels, especially around 10–40 µg/m³, while performance was weaker at very low concentrations and at very high, highly localised pollution levels such as traffic hotspots. The NO₂ study also compared S-MESH with the CAMS regional reanalysis. S-MESH captured much finer spatial detail, especially around cities and major roads, because of its 1 km resolution and the use of high-resolution input features such as night-time lights. For the 2020 annual average, S-MESH showed a lower relative error against station observations than the CAMS reanalysis.
For PM₂.₅, S-MESH was evaluated for 2021–2022 against independent station observations and compared with both the CAMS regional forecast and the CAMS regional interim reanalysis. The daily PM₂.₅ estimates achieved a mean absolute error of 3.54 µg/m³, compared with 4.18 µg/m³ for the CAMS forecast and 3.21 µg/m³ for the CAMS reanalysis. S-MESH also had a much smaller mean bias, −0.3 µg/m³, than the reanalysis, −1.5 µg/m³, and showed strong ability to follow day-to-day changes in PM₂.₅. A particular strength of the PM₂.₅ version of S-MESH is its performance during higher pollution events. At concentrations above 20 µg/m³, S-MESH outperformed the CAMS reanalysis in terms of bias and better captured high PM₂.₅ episodes, especially in parts of eastern Europe where residential heating can drive high wintertime pollution. It also provided substantially more local spatial detail than the coarser CAMS products. S-MESH is, however, less accurate at very low background PM₂.₅ levels and can miss some dust-driven PM₂.₅ events if they are not represented in either the CAMS forecast or available satellite aerosol data.
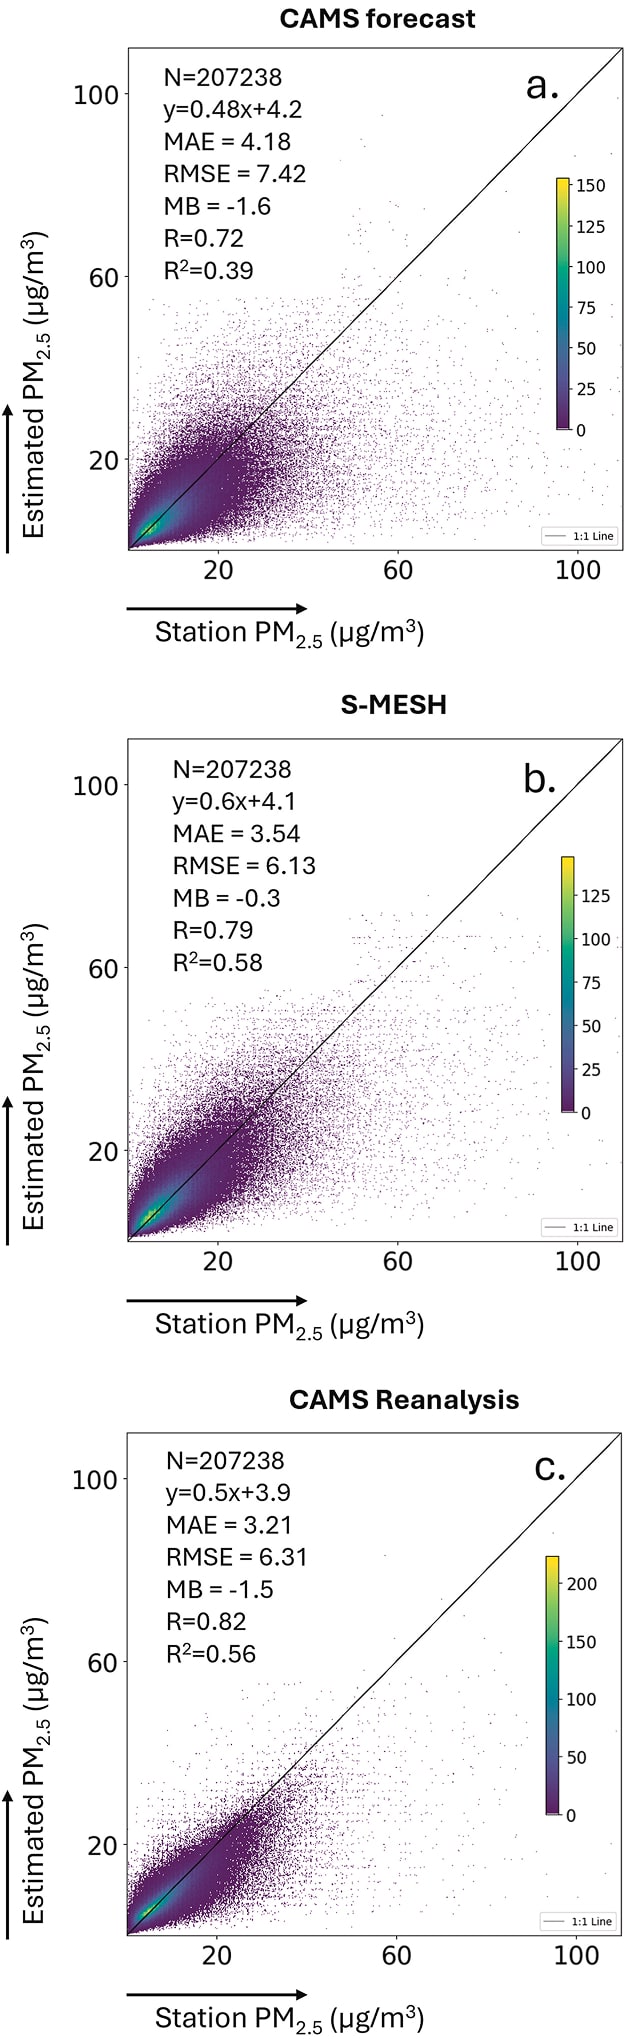
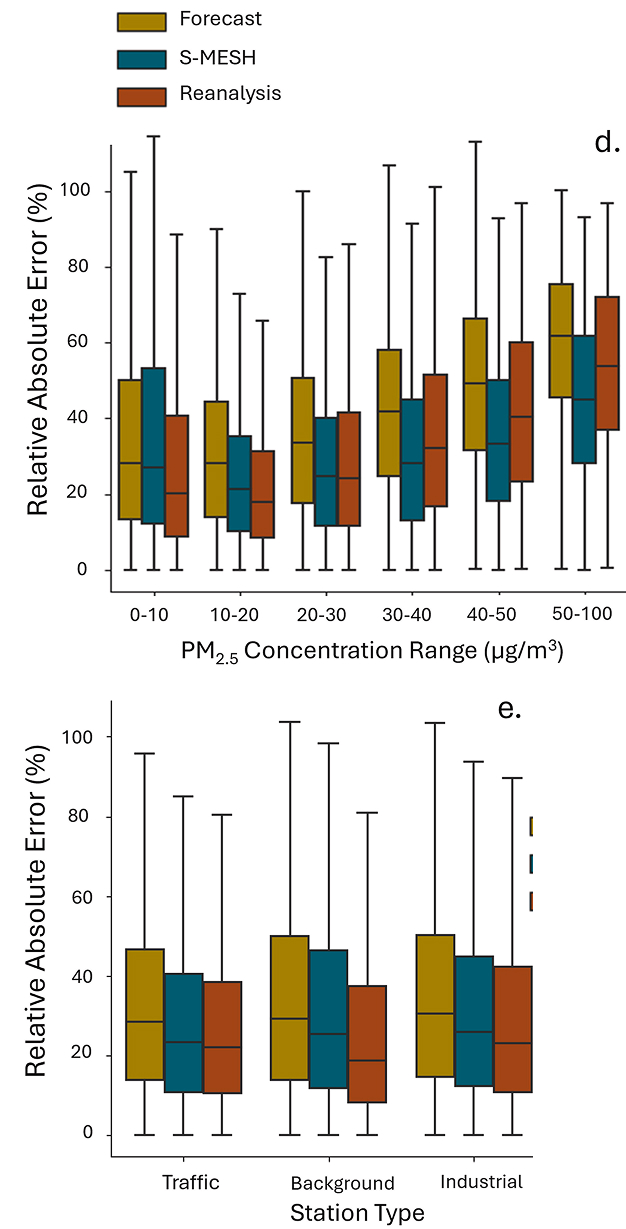
Figures: Evaluation of CAMS regional forecast, S-MESH, and CAMS reanalysis daily predictions for 2021–2022 against the test stations' daily observations. The first row shows scatter plots of model predictions against station observations for (a) CAMS forecast (b) S-MESH and (c) CAMS reanalysis. MAE, RMSE, and MB are given in μg/m3. The second row contains box plots (with 25th, 50th, 75th percentiles) of relative absolute errors (in percent) for all three approaches as a function of (d) concentration level and (e) air quality station type. From Shetty et al. (2025).
The following is a list of scientific articles that are either directly coming out of the CitySatAir research or in part linked to the work.
Shetty, S., Hamer, P. D., Stebel, K., Kylling, A., Hassani, A., Berntsen, T. K., & Schneider, P. (2025). Daily high-resolution surface PM2. 5 estimation over Europe by ML-based downscaling of the CAMS regional forecast. Environmental Research, 264, 120363.
Lepioufle, J. M., Schneider, P., Hamer, P. D., Ødegård, R. Å., Vallejo, I., Cao, T. V., … & Wojcikowski, M. (2024). Data fusion of sparse, heterogeneous, and mobile sensor devices using adaptive distance attention. Environmental Data Science, 3, e19.
Shetty, S., Schneider, P., Stebel, K., Hamer, P. D., Kylling, A., & Berntsen, T. K. (2024). Estimating surface NO2 concentrations over Europe using Sentinel-5P TROPOMI observations and Machine Learning. Remote Sensing of Environment, 312, 114321.
Ugboma, E. A., Stachlewska, I. S., Schneider, P., & Stebel, K. (2023). Satellite observations showed a negligible reduction in NO2 pollution due to COVID-19 lockdown over Poland. Frontiers in Environmental Science, 11, 1172753.
Schneider, P., Vogt, M., Haugen, R., Hassani, A., Castell, N., Dauge, F. R., & Bartonova, A. (2023). Deployment and evaluation of a network of open low-cost air quality sensor systems. Atmosphere, 14(3), 540. 120363.
Hassani, A., Schneider, P., Vogt, M., & Castell, N. (2023). Low-Cost Particulate Matter Sensors for Monitoring Residential Wood Burning. Environmental Science & Technology, 57(40), 15162-15172.